

Winds and Temperatures Aloft
How to read the Winds Aloft plots of observed wind and temperature at ten levels from the surface to 53,000 feet, and how to decode the winds aloft forecast text.
The Winds Aloft plots show the wind and temperature that weather balloons measured at a chosen height, for upper-air stations across the United States. Use them to see what the wind is doing at your cruising altitude and how it changes with height.
Where the data comes from
Twice a day, at 0000 and 1200 UTC, upper-air stations release a balloon carrying a radiosonde, a small instrument package that radios back temperature, humidity and pressure as it climbs. Tracking the balloon gives the wind. The plots are redrawn after each of these two launches.
Balloon data is reported by pressure level, not by height, so each plot is for one pressure level. The altitude shown with it is the typical height of that level. The true height changes a little from day to day and from one station to the next, so treat the altitudes as approximate.
Levels on weatherTAP
On the Aviation page, choose a level under Winds Aloft. Once a plot is open, the menu beside it switches between levels.
| Menu label | Pressure level |
|---|---|
| Surface | Surface |
| 5,000 ft | 850 mb |
| 10,000 ft | 700 mb |
| 18,000 ft | 500 mb |
| 24,000 ft | 400 mb |
| 30,000 ft | 300 mb |
| 34,000 ft | 250 mb |
| 39,000 ft | 200 mb |
| 45,000 ft | 150 mb |
| 53,000 ft | 100 mb |
Reading the plot
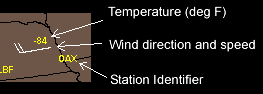
Each station is drawn as a wind barb showing the wind direction and speed. The yellow text beside the barb is the station identifier and the temperature in degrees Fahrenheit.
Winds aloft forecast text
The plots show what was measured. For what is expected, weatherTAP also carries the National Weather Service winds and temperatures aloft forecasts. On the Aviation page, open the Other Text tab and pick a region under Winds Aloft. The page lists the 6, 12 and 24 hour forecasts for each station at 3,000, 6,000, 9,000, 12,000, 18,000, 24,000, 30,000, 34,000 and 39,000 feet.
Each entry is a group of four digits for the wind, usually followed by a temperature:
| Coded | Meaning | How to read it |
|---|---|---|
2714 | Wind from 270° at 14 knots | The first two digits are the direction in tens of degrees true. The last two are the speed in knots. |
2725+03 | Wind from 270° at 25 knots, temperature +3°C | The signed number is the temperature in degrees Celsius. |
284045 | Wind from 280° at 40 knots, temperature −45°C | Above 24,000 feet the temperature is always below zero, so the minus sign is left off. |
9900 | Light and variable | Used when the wind is less than 5 knots. |
731960 | Wind from 230° at 119 knots, temperature −60°C | When the speed is 100 knots or more, 50 is added to the direction and 100 is taken off the speed. If the first two digits are between 51 and 86, subtract 50 from them and add 100 to the speed. |
Some entries are left blank near the ground. No wind is forecast within 1,500 feet of the station's elevation, and no temperature is forecast for the 3,000 foot level or within 2,500 feet of the station's elevation.
On this page
Related guides
- Wind Barbs and Sky Cover Symbols
- Jetstream Analysis
- Aviation Surface Observations
- Decoding TAFs and METARs
- Station Weather Symbols
- Surface Analysis Chart
Need a hand?
Call (866) 469-9982, Monday through Friday, 8:00 to 4:00 Central, or email support@weathertap.com.