RadarLab Local Help

RadarLab Local is the next generation of the RadarLab product set developed by WeatherTAP.com. This version of RadarLab is written in HTML5 and does not require Java. All you need is an Internet browser that supports HTML5 such as Internet Explorer 9+, Chrome, Firefox or Safari.

Menu

The RadarLab Local menu shows drop-down lists that contain different map layers that can be turned on or off. It also includes the "Options" drop-down list which allows the user to turn on and off things such as the storm track table and map legends. The "Tools" drop-down list contains buttons to open different windows such as the settings page or radar site status page.


Overlays

Airports
Displays the three letter identifier for local airports.
Lakes And Rivers
Draws lakes and rivers on the map. The user can define the color.
City Labels
Draws city and community labels on the map. The size of the label is determined by population.
County Boundaries
Draws county boundaries on the map. The user can define the line thickness and color.
County Names
Draws county names on the map. The county name is centered over the county.
Park Boundaries
Draws polygons representing park boundaries on the map. The user can define the color.
Park Names
Draws park names on the map. The names are centered over the park boundaries.
GPS Location
Display your GPS location on the map. Uses the browser's built in GPS function by default. You can use an external GPS as well on Windows machines.
Custom Locations
Displays the user defined custom locations. The user can add as many custom locations as he wants. It is no longer limited to 10 custom locations. The user can define the label size, position and color.
Custom Lines
Displays the user defined set of lines. The user can define the line thickness and color.
Interstates
Draws the interstates on the map. The user can define the line thickness and color.
US & State Roads
Draws US and state roads on the map. The user can define the line thickness and color.
State Boundaries
Draws state boundaries on the map. The user can define the line thickness and color.


Weather

Lightning
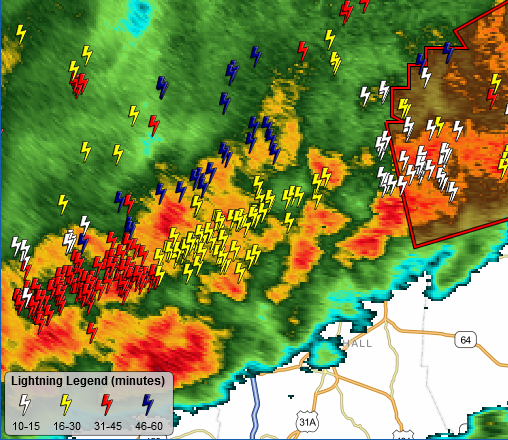
Displays lightning strike symbols in areas where lightning is occurring. The symbol is color coded depending on the age of the strike. Below is an example.


Storm Tracks
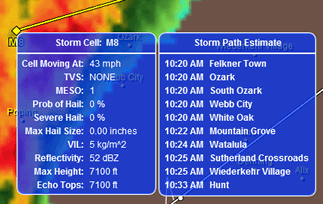
Displays the storm tracks on the map. The storm tracks are color coded depending on severity. The user can define the color and size of the storm tracks. Clicking on the storm track will show all the attributes associated with that storm track and a storm path estimate. Below is an example image.


Local Storm Reports
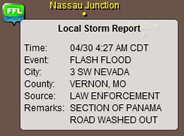
Displays Local Storm Reports issued by the NWS. These are reports of weather phenomenon or damage caused by weather events. They are reported by trained spotters, law enforcement, EMA and other personnel. Below is an example image.


SpotterNetwork
Displays information provided by the SpotterNetwork. These are reports issued by trained weather spotters and are similar to the Local Storm Reports issued by the NWS.
Current Temps
Displays the current temperatures on the map. This information comes from data issued by METAR reporting stations.
Surface Obs / Wind Barbs
Displays the latest surface observations from selected stations. The surface observation displays seven pieces of information:

1. Wind Barb and Cloud Cover
2. Altimeter (in Hg)
3. Ceiling and coverage of lowest cloud layer
4. Station ID
5. Dew Point (deg Fahrenheit)
6. Visibility (statue miles)
7. Temperature (degrees Fahrenheit)

Below is an example of a surface observation plot.

RadarLab HD

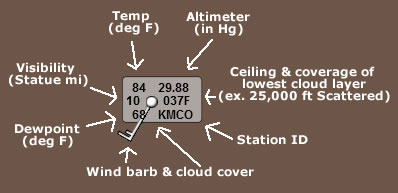
The above example depicts a surface report from Orlando, Florida (MCO). This observation indicates a temperature of 84 degrees and a dew point of 68 degrees. Sky is overcast with winds out of the South West at 15kts (wind barb notation). The current barometric pressure is 29.88 inches of mercury and visibility is 10 statute miles. The "037F" designation immediately to the right of the wind barb indicates both the altitude and coverage density of the LOWEST cloud layer. The first three digits indicate the ceiling altitude in hundreds of feet. The 'F' that immediately follows indicates that the clouds are few. Possible values of the coverage density indicator are:

"CLR" = Clear
"F" = Few
"S" = Scattered
"B" = Broken
"O" = Overcast

Although the "037F" indicates a few clouds, the wind barb shows overcast coverage. This indicates that an overcast layer lies above the few layer at 3,700 ft.

(For FAA purposes 'scattered' or 'few' clouds do not constitute a "ceiling", however, the altitude of any reported cloud layer is portrayed on the map regardless.)
 
Tornado Watches
Draws polygons on the map representing tornado watches issued by the NWS. The polygon can be clicked to see when the watch will expire. It can be clicked again to view the actual NWS text for the watch. The user can define the color of the watch.
Severe T'storm Watches
Draws polygons on the map representing severe thunderstorm watches issued by the NWS. The polygon can be clicked to see when the watch will expire. It can be clicked again to view the actual NWS text for the watch. The user can define the color of the watch.
Flash Flood Watches
Draws polygons on the map representing flash flood watches issued by the NWS. The polygon can be clicked to see when the watch will expire. It can be clicked again to view the actual NWS text for the watch. The user can define the color of the watch.
Other Watches
Draws polygons on the map representing all other watches issued by the NWS. The polygon can be clicked to see what type of watch it is and when it will expire. It can be clicked again to view the actual text the NWS sent for the watch. The user can define the color of the watch.
Tornado Warnings
Draws polygons on the map representing tornado warnings issued by the NWS. The polygon can be clicked to see when the warning will expire. It can be clicked again to view the actual NWS text for the warning. The user can define the color of the warning.
Severe T'storm Warnings
Draws polygons on the map representing severe thunderstorm warnings issued by the NWS. The polygon can be clicked to see when the warning will expire. It can be clicked again to view the actual NWS text for the warning. The user can define the color of the warning.
Flash Flood Warnings
Draws polygons on the map representing flash flood warnings issued by the NWS. The polygon can be clicked to see when the warning will expire. It can be clicked again to view the actual NWS text for the warning. The user can define the color of the warning.
Other Warnings
Draws polygons on the map representing all other warnings issued by the NWS. The polygon can be clicked to see what type of warning it is and when it will expire. It can be clicked again to view the actual text the NWS sent for the warning. The user can define the color of the warning.
Advisories
Draws polygons on the map representing the advisories issued by the NWS. The polygon can be clicked to see what type of advisory it is and when it will expire. It can be clicked again to view the actual text the NWS sent for the advisory. The user can define the color of the warning.


Maps

Land/Sea
Displays the land and sea (brown and blue) map background image.
Terrain
Displays the low resolution terrain map background image.
Detailed Terrain
Displays the higher resolution terrain map background image.
IR Satellite
Displays the infrared satellite image as the map background.
Visible Satellite
Displays the visible satellite image as the map background.


Controls

This shows the map controls. You can stop and play the animation as well as step backwards or forwards in the animation sequence. The "Zoom" section allows you to zoom in, out or cancel the zoom. Under the "Mouse/Refresh" section, you can put the mouse in zoom mode or measure mode. You can also refresh the data by pressing the refresh button.


Options

Storm Table
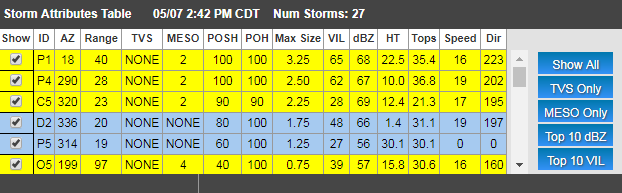
Displays the storm table at the bottom of the map. This shows all the storm track attributes. Each row in the table is colored the same color as the storm track. The user can use this table to show only the storm tracks he is interested in seeing. Below is an example image.


Timestamps
Displays the timestamps in the upper left corner of the map for each data overlay that is currently on.
Radar Info Panel
Displays the Radar information panel. This shows things like the resolution, mode and VCP of the current radar.
Alarm On
Turns on alarming for the user's defined alarm area. Click on the settings button to setup an alarm area.
Draw Alarm Area
Draws a red circle on the map showing where the user's defined alarm area is currently located.
Play Alarm Sound
If checked, an alarm sound will be played when the user's alarm criteria has been met.
Real-Time Lightning Area
Draws a red box on the map showing where the user's real-time lightning area is currently located.
Real-Time Lightning Legend
Displays the real-time lightning legend in the bottom left corner of the map.
Radar Legend
Displays the radar legend in the bottom left corner of the map.
WWA Legend
Displays the WWA legend in the bottom left corner of the map.
Storm Track Legend
Displays the storm tracks legend in the bottom left corner of the map.


Tools

Settings Page
Opens a window with all the RadarLab Local settings.
Filter Radar
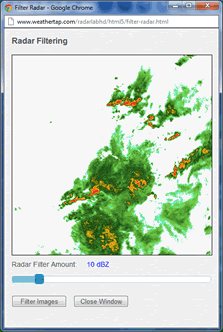
Opens a window with the current radar image and a slider to determine the amount of filtering to apply to the image. Once the filtering value has been set, click the "Filter Images" button to apply the filter to the currently loaded radar images.


Change Radar Site
Opens a map with radar sites. Click a radar site to load it.
Site Status
Opens a window with the site status for the currently loaded radar site.
Save Image
Opens a window that allows the user to save the currently display RadarLab HD+ image.
Help
Opens the RadarLab Local help page.
WeatherTAP Home
Loads the WeatherTAP homepage.
Log Out
Logs the user out of the website.


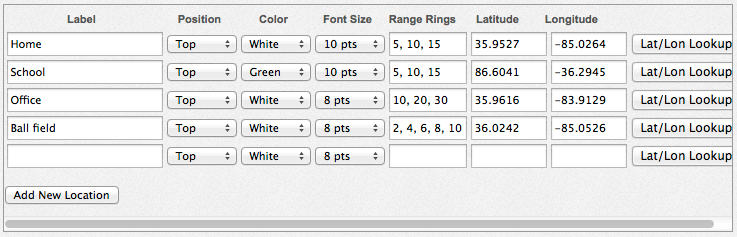
Set Custom Locations & Range Rings

Settings Page
Click the RadarLab Local settings button located on the "Tools" drop-down menu.
Custom Locations
Click the Custom Locations link in the resulting page.

Custom Locations Link

Set Locations
The Custom Locations link will result in a form enabling the user to plot custom/current locations, labels, range rings, and more. There is a convenient Lat/Lon Lookup guide if needed.

Custom Locations

Save Locations
Plot your positions, label them, color them, choose font sizes, set range rings by mileage, then click the "Save Custom Locations" button.