

Current and Forecast Icing Potential
How to read the Current Icing Potential (CIP) and Forecast Icing Potential (FIP) maps: what the colors mean, how to pick an altitude and forecast hour, and what supercooled large drops are.
The icing potential maps show where an aircraft is likely to pick up ice in flight, level by level. Current Icing Potential (CIP) is a diagnosis of conditions now. Forecast Icing Potential (FIP) carries the same idea forward up to 12 hours.
What CIP and FIP are
CIP is produced automatically every hour. It was developed by the In-Flight Icing Product Development Team under the Federal Aviation Administration's Aviation Weather Research Program. The algorithm combines satellite and radar data, surface observations, lightning data and pilot reports with forecast model output to build a three-dimensional picture of the atmosphere. It first works out where there is cloud and precipitation, then estimates how likely it is that the cloud at each point holds supercooled liquid water: droplets that are still liquid below freezing and that freeze onto an airframe on contact.
FIP applies the same reasoning to a forecast. There are no observations of the future, so it depends on model output alone and is less certain than CIP, more so at the later hours.
Supercooled large drops (SLD)
Most icing comes from small cloud droplets, which freeze on the leading edges where an aircraft's ice protection is. Supercooled large drops, in effect freezing drizzle or freezing rain aloft, are big enough to run back before they freeze, and can build ice behind the protected areas. SLD is a serious hazard even for aircraft certified for flight in icing, so it is mapped separately.
Using the maps on weatherTAP
Open Current Icing Potential or Forecast Icing Potential under Icing on the Aviation page. A grid of boxes above the map chooses what you see:
- Altitude, across the top: about 3,000, 6,000, 9,000, 12,000 and 15,000 feet, then flight levels 180 through 300 in steps of 2,000 feet.
- Total or SLD, on the Current map. Total is the potential for icing of any kind. SLD is the potential for supercooled large drops.
- Forecast hour, on the Forecast map: +1, +2, +3, +6, +9 or +12 hours.
Click a box to load that map. The menu beside the map switches between the Current map, the Forecast map and the Icing AIRMETs map.
Reading the colors
Colored areas show the computed icing potential at the level you chose, as a percentage. Cool colors are low values and warm colors are high. Where there is no color, the potential at that level is close to zero.
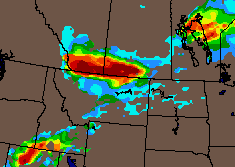

Likely is not the same as severe. The map shows how probable icing is, not how fast ice will build. Check several altitudes to find the top and bottom of the icing layer, and use the maps together with the icing G-AIRMETs, SIGMETs and pilot reports on the Aviation page. They do not replace those products.
Related guides
- Weather and Precipitation Symbols
- Surface Prognosis Charts
- Decoding TAFs and METARs
- Weather Depiction Chart
- Aviation Surface Observations
- Station Weather Symbols
Need a hand?
Call (866) 469-9982, Monday through Friday, 8:00 to 4:00 Central, or email support@weathertap.com.