Decoding Guide
Surface Analysis Chart
Abstract:
This chart depicts the location of fronts, troughs, and instability lines,
along with high and low pressure centers.
Description:
This product is a combination of a Surface front plot (yellow), and a MSL
Isobar plot (white). The Isobar plot depicts the current positions of surface
highs and lows, and mean sea level pressure over North America. The surface
front plot is an analysis showing the current location of surface fronts,
troughs, and instability lines. Tropical cyclone positions are included
as appropriate.
Issuance:
0000, 0300, 0600, 0900, 1200, 1500, 1800, and 2100 UTC
Data Sources:
Surface observations, Radar and Satellite observations
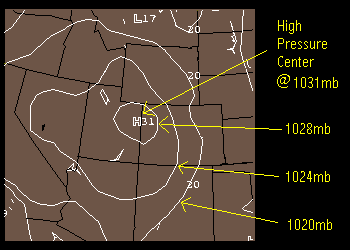
Depiction:
The isobar plot, colored in white, shows the location of high and low pressure
centers. High and Low pressure centers are depicted using

and

symbols. White contour lines (in
intervals of 4mb) indicate areas of uniform pressure. Pressure values appear
close to the pressure center symbol or contour line and are given in units
of millibars. Generally, add a prefix of 9 to the value if the plotted pressure
value is greater than 50 and a prefix of 10 if the plotted value is less
than 50.
Example:
The surface front plot, colored in yellow, shows the current location of
fronts using
standard front symbology.