
Satellite Tutorial
Satellite Background
The GOES Imager and Interpreting weatherTAP Satellite Imagery
A satellite is a body or mass which orbits a larger body or mass. The moon is an example of a satellite. Weather satellites are man-made machines that orbit the earth in either a sun-synchronous orbit (POES) or are geostationary (GOES) (see below). The sensors onboard weather satellites help to image and research atmospheric, oceanic and land systems by looking at specific frequencies in the electromagnetic spectrum. The most common frequencies sensed are visible light, infrared and microwave radiation. Weather satellites are initially placed into orbit with rocket boosters or by the Space Shuttle.
Satellites are useful for weather observation because they are at an ideal vantage point. Satellites are placed either in a low altitude orbit (POES) or in a high altitude stationary spot (GOES), but both are well above the troposphere (the lowest sphere in the atmosphere) which is where most of Earth's weather takes place. This makes weather satellites immune to any weather effects and gives it a clear view of the weather patterns below.
Satellites can be launched into a variety of orbits, but the two most common orbits for weather satellites are sun-synchronous and geosynchronous. A sun-synchronous orbit has a low altitude (~528 miles) with a period of 98 to 102 minutes (approximately 14 orbits per day) and passes over the same part of the Earth (equator for example) at the same time each orbit. The Earth rotates as the satellite orbits around it. Further, the track of the orbit is slightly tilted so that it does not go exactly over the poles. This helps the satellite to have slightly overlapping tracks for complete daily global coverage. Polar orbiting satellites commonly use this type of orbit.
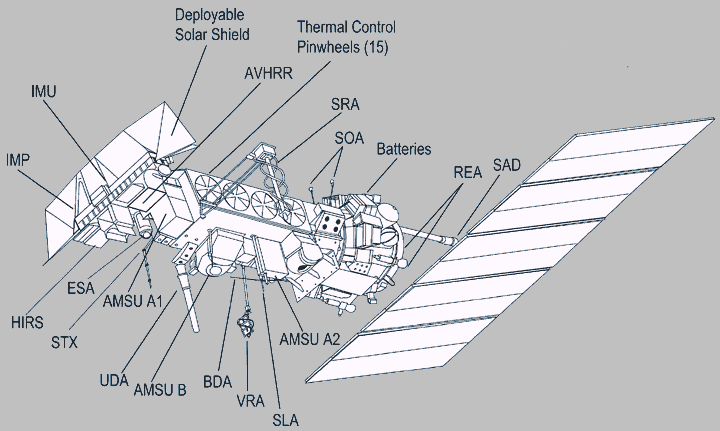
There are several types of polar orbiting satellites used for weather observation. POES ( Polar Operational Environmental Satellites, KLM series) are operated and maintained by the National Oceanic and Atmospheric Administration (NOAA) and the instruments onboard have a spatial resolution of 1.1km per pixel. DMSP (Defense Meteorological Satellite Program) are operated by the Department of Defense (DoD) but maintained by NOAA and the instruments onboard have a spatial resolution range from 550m (0.55km) to1.1km per pixel. MODIS (MODerate-resolution Imaging Spectroradiometer) are operated and maintained by NASA and the instruments onboard have a spatial resolution range from 250m (0.25km) to 1km. Although polar orbiting satellites have a high spatial resolution (depending on the satellite), the temporal resolution is poor compared to geostationary satellites.
POES Spacecraft
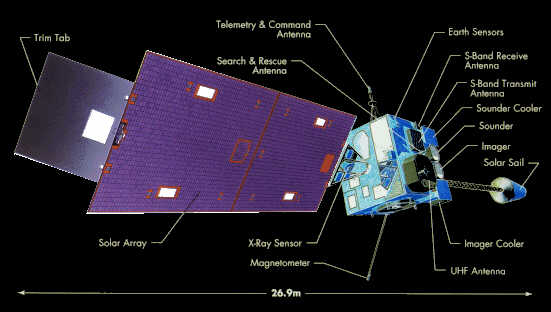
Geosynchronous satellites are at a fixed position above the earth and are at a higher altitude than sun-synchronous satellites. The satellite is positioned at a high enough altitude from the Earth (usually around 22,236 miles) such that its orbital velocity coincides with the rotation of the Earth. Essentially, the satellite's speed matches the speed of the Earth's rotation and the satellite appears to be stationary relative to a fixed point on the surface. An advantage of a geosynchronous satellite over a sun-synchronous satellite is that it can monitor the same area in a greater amount of time, thus improving the temporal resolution. GOES (Geostationary Operational Environmental Satellites), which are in a geosynchronous orbit, transmit data every 15 minutes of the CONUS (Continental United States) with a "full disk" (entire hemispheric) scan every 3 hours. Further, they are able to transmit data every minute (rapid scan mode) and every half minute (super rapid scan mode) for a particular area when scheduled. During severe weather events, such as hurricanes, data can be transmitted every 5 minutes for constant monitoring as was the case during Hurricanes Katrina (2005) and Rita (2005). Although GOES satellites have a greater temporal resolution, the spatial resolution is more coarse with the exception of the visible imagery, which is approximately 1km. The spatial resolution of the remaining sensors range from 4km to 8km depending on the sensor (see table below for more information). weatherTAP receives data from two GOES satellites, GOES-15 (West) and GOES-13 (East) which cover most of the western hemisphere.
GOES Spacecraft
Both GOES-15 and GOES-13 have instruments which detect energy (either emitted or reflected) from Earth. Although this data can be used many different ways, weatherTAP organizes data from the GOES imagers into photograph-like images. GOES has five imager channels which detect energy at different wavelengths.
GOES Imager Channels| Channel | Wavelength | Common Name | Channel Used For |
|---|---|---|---|
| Channel 1 (VIS) | 0.55 - 0.75 µm | "Visible" Imagery | Cloud cover, ice and snow cover, pollution and haze detection (daytime only) |
| Channel 2 (IR2) | 3.8 - 4.0 µm | Short wave or Mid Infrared | Cloud cover, sea surface temps, fog detection at night |
| Channel 3 (WV)* | 6.5-7.0µm | Water Vapor | Mid-to upper level moisture content and movement |
| Channel 3 (IR3)** | 13.0-13.7 µm | Split-Window Infrared | Cloud cover and height, cloud top pressure |
| Channel 4 (IR4) | 10.2-11.2 µm | Long wave or Thermal Infrared | Cloud cover, land/sea temp patterns |
| Channel 5 (IR5)* | 11.5-12.2 µm | Split-Window Infrared | Cloud cover, low level moisture |
| Channel 5 (IR5)** | 5.8 - 7.3 µm | Water Vapor | Mid-to upper level moisture content and movement |
| * GOES - 15 (West) | |||
| ** GOES - 13 (East) | |||
Generally, a GOES satellite transmits data of the CONUS (Continental United States) every 15 minutes. It is not uncommon for the satellites to deviate from the schedule and transmit data more often due to severe weather events, astronomical events and satellite maneuvers. If one of the GOES satellites is taken off-line, the other will compensate by transmitting "full-disk" imagery more often than scheduled (full-disk are images of the entire earth depending on which hemisphere it is positioned over.) For more information, please refer to the temporal resolution section of the document.
As the sun's light and heat energy reaches the Earth, the energy is reflected (detected by the visible imager) and emitted (detected by infrared imager) by the Earth. weatherTAP provides many different satellite images at various spatial and temporal resolutions; however, all images fall under one of the five categories corresponding to a GOES imager channel. weatherTAP offers all five imager channels which are visible imagery, long wave infrared imagery, short wave infrared imagery, split-window infrared imagery , and water vapor imagery but mainly features data from visible, long wave infrared and water vapor imagery.
Visible satellite images are essentially photographs taken from space. All of the energy collected by the visible sensors (cameras) on board the satellite is light energy from the sun reflected by the Earth. The reflectance is a measure of albedo, which is the percentage of light energy reflected by the earth. The higher the albedo the more light reflected back into space whereas the lower the albedo, the more light energy absorbed. Examples of high albedo include thick storm clouds such as cumulonimbus, cirrostratus (with low clouds present) and snow which appear bright white in imagery. Examples of low albedo include cirrus and cirrostratus (with no low clouds present) which appear a lighter gray, land (which appears a dark gray), and water (which appears almost black).
Some strengths of visible imagery are:
- greater spatial resolution than the other channels (~ 1kmX1km per pixel)
- detection of snow and fog (in a visible animation, snow does not move and fog moves very little)
- identification of overshooting storm tops during severe weather
- identification of smoke, haze and pollution
- locating sea breeze fronts
Some weaknesses of visible imagery are:
- useless at night (no light)
- hard to distinguish lower-, mid- , and upper-level clouds
The thermal infrared channel is sensitive to the energy being emitted from the Earth. As the suns energy reaches Earth, a percentage of it is reflected back into space and a percentage is absorbed. The energy reflected is detected by visible imagery, but the energy absorbed is emitted from the Earth as heat energy. This heat energy is detected by infrared sensors meaning that this image is useful at depicting clouds during the day and at night. Since atmosphere temperature decreases with increasing height (the higher in altitude you go, the colder it gets), clouds show up as lighter colors whereas the surface of the Earth shows up as darker colors due to the surface being warmer.
weatherTAP features gray scale and color enhanced IR4 imagery. The color
enhancement helps to enhance the coldest cloud tops on the image. This
enhancement is especially useful in identifying areas of convective storms
(thunderstorms) and helping to determine where precipitation is occurring.
It is especially useful at night when visible imagery is not available
and areas of severe weather need to be identified.
When using IR4 imagery, it is important to note that the contrast of the
image will vary between day and night. This is due to the temperature
at the surface of the Earth being greater during the day than at night.
Due to this temperature difference, the surface will appear darker during
the day than at night which makes it difficult to distinguish the difference
between the surface and low clouds at night. To overcome this, the satellite
animation can be viewed to see where movement occurs. Low surface clouds
will move with time and can be easily distinguished from the surface.
| IR4 Imagery of Hurricane Wilma (2005) | |
 |
 |
Thermal IR Temperature Gray Scale
![]()
Thermal IR Enhanced Temperature Color Scale
![]()
Some strengths of IR4 imagery:
- imagery is available both day and night
- able to distinguish low milile and high level clouds, especially when enhanced
- able to easily distinguish cold convective cloud tops when enhanced
- able to distingue severe weather features when enhanced (v-notch and micro-bursts for example)
- identification of urban heat islands
- ability to identify the "eye" feature in a tropical system when it is cloud covered
Some weaknesses of IR4 imagery:
- coarse resolution (4km per pixel)
- difficult to distinguish land/ocean boundaries during day to night transitions (vice versa). This is primarily due to the land heating and cooling faster than the ocean.
Water Vapor imagery is a measure of the amount of water vapor contained in the mid to upper levels of the troposphere (~600mb - 100mb). Water vapor absorbs and re-emits energy at various wavelengths of the electromagnetic spectrum, but the most notable wavelength is within the 6.5 to 7.4 micron range. Water vapor imagery can be used to determine moisture advection (horizontal transport from one region to another), vertical movement of air (rising and sinking or air) and synoptic features such as short wave troughs, ridges and jet streams.
weatherTAP features water vapor imagery in gray scale and color enhanced. Using gray scale imagery, the darker the color appears the dryer the air whereas the brighter the color appears the more saturated the air. Color enhanced imagery helps to show how saturated an area is. Hurricanes have extremely high moisture saturation amounts in the mid to upper atmosphere and can be easily seen using the color enhancements. It is not uncommon to see dark to light purples associated with hurricanes.
| Water Vapor Imagery of Hurricane Wilma (2005) | |
 |
 |
Water Vapor Gray Scale
![]()
Water Vapor Enhanced Color Scale
![]()
Some strengths of WV imagery
- imagery is available both day and night
- easy identification of tropical moisture plumes
- ability to identify where dry and saturated areas are in the mid to upper troposphere
- ability to use moisture as a passive tracer to detect movement in the troposphere
- ability to identify the "eye" feature in a tropical system when it is cloud covered
Some weaknesses of WV imagery:
- Coarse resolution; GOES-13 (East) at 4km and GOES-15 (West) at 8km
The mid-infrared channel is unique in that it portrays some emitted and some reflected energy. The image can be interpreted much like the thermal infrared image with colder cloud tops extending higher into the atmosphere. The physical characteristics of this particular energy wavelength make this image useful for identifying fog when coupled with IR4, spotting forest fires and distinguishing the difference between water and ice clouds.
The Split-Window Infrared (also called "Dirty" Infrared) channel portrays emitted energy from the surface of the Earth. This channel is a bit more sensitive to water vapor than the similar "Thermal" channel. This wavelength is often used for identification of low-level moisture, determination of sea surface temperature, and detection of airborne dust and volcanic ash.
** Note that the IR2/IR5/IR6 are featured on the satellite page, but the main imagery featured are Visible, IR4, and WV.
weatherTAP features a satellite interface which can easily navigate satellite imagery between areas and zoom levels. The interface toggles between visible/IR4/WV imagery, animated/still imagery and u- enhanced/enhanced imagery. The bottom of page contains links, where the zoom level and navigation are controlled. The color scale is also featured under the image.
Resolution
Resolution can refer to a number of things, but the two most common used by weatherTAP are spatial and temporal, which are detailed below.
Spatial resolution refers to the area that one pixel represents. For example, the resolution of the visible imagery is approximately 1km X 1km. This means that one square pixel represents 1km by 1km. The smaller the resolution values the more details that are present in the image. Visible imagery is the highest resolution imagery currently available on weatherTAP. Below is a table with the spatial resolution of the other GOES channels.
| Channel | Resolution (area per pixel) |
|---|---|
| Channel 1 (VIS) | 1.0159 km |
| Channel 2 (IR2) | 4.063 km |
| Channel 3 (WV) | 8.1271 km * / 4.063 km ** |
| Channel 4 (IR4) | 4.063 km |
| Channel 5 (IR5)* | 4.063 km |
| Channel 6 (IR6)** | 8.1271 km |
| * GOES-15 (West) | |
| ** GOES-13 (East) | |
Temporal resolution refers to the time at which satellite imagery is received. For example, the Atlantic region has poor temporal resolution due to it only being received every 30 minutes whereas the Eastern US region has better temporal resolution as it is received every 15 minutes. Temporal resolution improves during severe weather events in that images are transmitted almost every 5 minutes.
A good example of high temporal resolution is when Hurricane Rita (2005) traversed the Gulf of Mexico until landfall; the temporal resolution of the Eastern US images was about 5 minutes. This enabled the viewer to watch the details of hurricane growth (overshooting cloud tops, eyewall replacement cycles, etc.) and decay (traversing cooler water and landfall).
Since the visible channel resolution is 1km, the resultant images are very large. However, the image is available in a JPG format (to reduce file size) at its full resolution. Further, weatherTAP has broken the visible image into more convenient regions retaining the 1km resolution. The complete high resolution image and individual regions can be found at the bottom of weatherTAP's satellite page.
weatherTAP animates the latest 10 images that were received. This makes the temporal resolution vary because the satellite imagery is not received at the same time (see above under temporal resolution). Below is a table that illustrates the possible time spans that can be encountered when using satellite imagery.
| Imagery | Temporal Resolution | Animation Time Length |
|---|---|---|
| Severe Weather Events | 5-10 min | Less than an hour to 1hr 40min |
| Normal Operations | 15 min | 2hrs 30min |
| Atlantic Basin, Caribbean | 30 min | 4 hrs |
| Global Northern Hemispheric | 3hr | 30 hrs (1 day, 6hrs) |